Fueled by a mix of Red Bull, coconut milk, cranberry juice, and good old wish-I-was-back-in-the-islands 151-proof rum, I've outputted a few more test animations from my Worldlog software. These are all based on usage stats from my friend ServMe's FriedKitten blog, which is an ideal test because it gets a decent amount of hits, but not so many that it takes a long time to process.
 |
 |
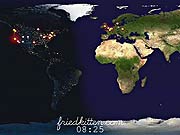 |
The right animation is an hourly animation, with every frame being five minutes of access, and is also partially zoomed in. The usage is surprisingly flat (usually the time of day has more of an effect on usage) so I have a nagging feeling there's a problem, but I haven't found it in the code so I'm not sure… Anyway, it's coming along nicely, but now it's back to real work so this project is going to have to stall for a little while. Thanks to everyone who helped me out by sharing log files.


Post a Comment