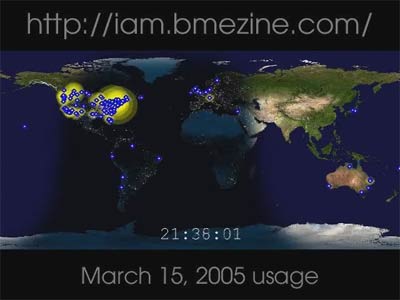
The video below shows user activity over a twenty-four hour period on the members-only iam.bmezine.com site. This site has about 10,000 active members around the world, about half of which have entered their geographical location, and about two or three hundred of which are online and active at any given moment. This video has a time-resolution of about one minute and plots their activity over one day of usage (starting at about noon EST on March 15, 2005).

4.5 meg WMV file
I thought some people reading this might be interested in knowing how this was done so they could implement it on their own sites (it's not hard — easy in fact!). So here's how, start to finish…
How it's done: Rendering the map While my complete dynamic-scaling mapping system (which this is based on) is actually over 1,600 pre-rendered image files to do fast zooms of the planet down to about a 1km resolution in both daytime and nighttime modes, the version that renders with rolling night and day regions on the same map is actually much simpler. Three main image files are needed. Below are smaller versions of the ones I use (I render initially at 2,700×1,350 pixels and then resize before outputting).
 |
 |
 |
| Daytime | Nighttime | Alpha Channel |
/calculate number of minutes since midnight (0-1439)
current.minute = (time.hour * 60) + time.minute
/scale this to match the main image width (2700 pixels)
slider = (current.minute * 2700) / 1440
/move it over a bit so that it matches EST, wrapping if need be
slider = slider + 550
if slider >= 2700, then slider = slider 2700
/crop it
crop alpha.jpg at (slider,0) to size (2700,1350)
The alpha map now matches the main images in size, and represents a day/night picture of the current time as well. The daytime image is used as a base, and then the nighttime image is pasted on top of it using this alpha map to set the transparency, and voila, a pretty image containing both day and night scenery — and not just a dimming, but a real nighttime view.
After that, I just add the current IAM usage information, adding all users who are online and have provided their location to the system. If more than one user is online in the same location, a “glow” representing the number of users is drawn around them. I'm using an equidistant cylindrical projection map, so it's very easy to plot points via latitude and longitude to it without having to do any complicated math. Anyway, then I write the time onto the map and output it as a JPG image and I'm done.
An older version (2.2) of Smaller Animals' ImgSource graphics library is used for most of the image handling internally, inside a PB/CC wrapper.
How it's done: Creating the video
To capture the frames, I use my old “camthief” utility which I wrote years ago to download sequential images from my now-wife's webcam. It allows you to specify a URL and a time interval (among other minor settings) and then grabs every new image it sees. It occasionally runs into communications errors (and sometimes the server stalls) so I put it into a batch file that executes the command over and over and over to ensure it would survive almost any contingency.
If you'd like to have a copy of this program, you can download it here: When a day had passed, I had a numbered sequence of about 1,500 images representing the frames. They were a non-standard size, so I wrote a Photoshop action to resize them and add a header and footer. After that, using the free RAD Converter I turned these into an uncompressed AVI file, which I then compressed to a WMV file using the (also free) Microsoft Movie Maker. All very easy!
https://zentastic.me/viabme//camthief.exe — it's 33k and runs from a Win32 command prompt.


Post a Comment